Support and Resistance Lines from Data File Indicator
Another free indicator brought to you by the author of NinjaScript Programmer's Launch Pad V8. Feedback welcome.
Overview
This indicator for NinjaTrader 8 reads support and resistance line data from a comma-separated values text file and draws them on the price chart. This way, you can have a single location to hold and maintain the support and resistance lines data, and use them in multiple charts for the same instrument. The indicator does not analyze the market to determine where the lines should be, it simply draws them on the chart based on the data in the file. You can download the indicator here.
The data is structured so that another indicator could be developed to determine where the lines should be, and then write them to the data file. The last field in the data is called “Persistence” and it can hold one of two values: “Purge” or “Retain”. The idea is that any rows of data that the to-be-developed indicator writes would be purgeable (overwritable), but any rows that are manually entered could be marked as “Retain” so the to-be-developed indicator would know to not overwrite them. This way, you can use a to-be-developed indicator to build a list of what it thinks are support and resistance lines, and you can add other lines manually if you see some that the indicator did not pick up. I have not written that indicator yet. Maybe one day.
Also, the data is structured to support both start and end times for the lines. This way, even though a line may no longer be considered active, it can still be used for historical analysis and viewing. The end time can be left empty to indicate that the line is still considered active, and then deactivated later by specifying an end time for it.
The indicator is designed to be used by other indicators for analysis purposes. You can pass the indicator a price and time (like the current price and time) and get in return the nearest support or resistance line to that price active at that time. Lines are classified by primary and secondary type attributes, so you can assign a “weight” to the importance of the line in your analysis code, based on the primary and secondary type attributes. Details are discussed later in this document.
One data file holds support and resistance line data for just one instrument. In fact, you might have one for intraday and one for longer time frames per instrument. I recommend the following naming convention for the data files, using the futures contract, NQ as an example:
NQ_Intraday.srlines
NQ_Daily.srlines
You can use whatever naming convention you like.
You can download an Excel spreadsheet template here that can make it easier to create the data file. It's zipped up with a sample .srlines csv file. Do not try to load this zip file into NinjaTrader; it is not an indicator.
As of this writing, the indicator appears to be working on time and tick-based charts (minute, second, daily, tick). I have not yet tested it on other types. It has not received extensive testing, so if you find a bug, please let me know at info@ninjalaunchpad.com. There are some unit tests that come with it as a separate indicator (BzvTESTSRLines), but they only test the collection and line add ons, not the indicator itself.
The indicator depends pretty heavily on good data; it does not do a whole lot of data validation. However, if it comes across a line of data that it doesn’t understand, it will print the fact in the output window and then just move on to the next row of data. You can review the output window to find poorly formatted data. It won’t help you find properly formatted data with wrong values. You’re entirely on your own for that.
Setting Up the Data
The format of the comma-separated values text file is very straight forward. You can use the spreadsheet template mentioned above to manually enter data into the sheet and then save it as a .csv file. Here’s a screen shot of the entry form in the spreadsheet: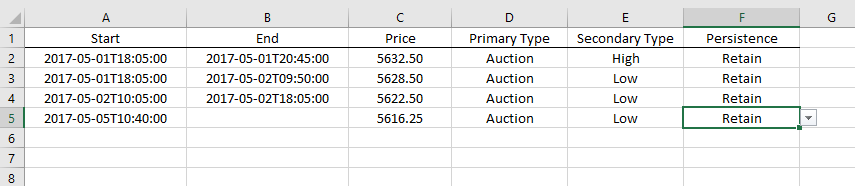
Column Descriptions
| Name | Format | Description | Possible Values |
|---|---|---|---|
| Start | yyyy-MM-ddThh:mm:ss | Start date and time for the line. | Prior to the current time, but usually starting in previous days. Cannot be empty. Can include milliseconds. |
| End | yyyy-MM-ddThh:mm:ss | End date and time for the line. | Prior to the current time, but usually ending in previous days or empty to indicate no end time. Can include milliseconds. |
| Price | The price value at which to draw the horizontal line. | The price at which support or resistance to price movement is expected. | This is a numeric value that relates to the instruments price type. |
| Primary Type | Text | A primary classification of the line type, such as Auction or Range. | Auction, Range, Other. The spreadsheet has a drop-down list to select the values from. |
| Secondary Type | Text | A secondary classification of the line type, such as High or Low. | High, Low, VPOC, POC, Other. The spreadsheet has a drop-down list to select the values from. |
| Persistence | Text | For future use with an indicator that automatically discovers support and resistance lines. The idea has already been explained, but the indicator should not overwrite lines marked as “Retain”. | Retain, Purge. The spreadsheet has a drop-down list to select the values from. |
Note: When you save the file as a csv file, look at the contents and make sure empty lines (with all commas) at the end get deleted. It shouldn’t hurt much to leave them there, but they won’t help either.